Plots are one of the most powerful tools in data visualization, transforming raw data into clear, visual stories. Whether you’re analyzing business trends, tracking scientific experiments, or building dashboards, plots make patterns, correlations, and anomalies easier to understand at a glance.
Why Plots Matter in Data Analysis
Without visualization, datasets can be overwhelming. Plots make data accessible, engaging, and actionable by:
- Highlighting patterns that spreadsheets alone can’t reveal.
- Supporting data-driven decision making.
- Making reports and presentations visually appealing.
Best Practices for Creating Effective Plots
To ensure your plots are accurate and easy to interpret:
- Choose the right plot type for your data.
- Label axes and legends clearly to avoid confusion.
- Use colors and markers wisely to enhance clarity.
- Avoid unnecessary clutter—simplicity improves understanding.
In summary, plots are the foundation of effective data visualization. They help turn raw numbers into compelling visuals that drive insights, communication, and decisions. Whether you’re building a quick chart or a complex interactive dashboard, mastering plots is essential for anyone working with data.
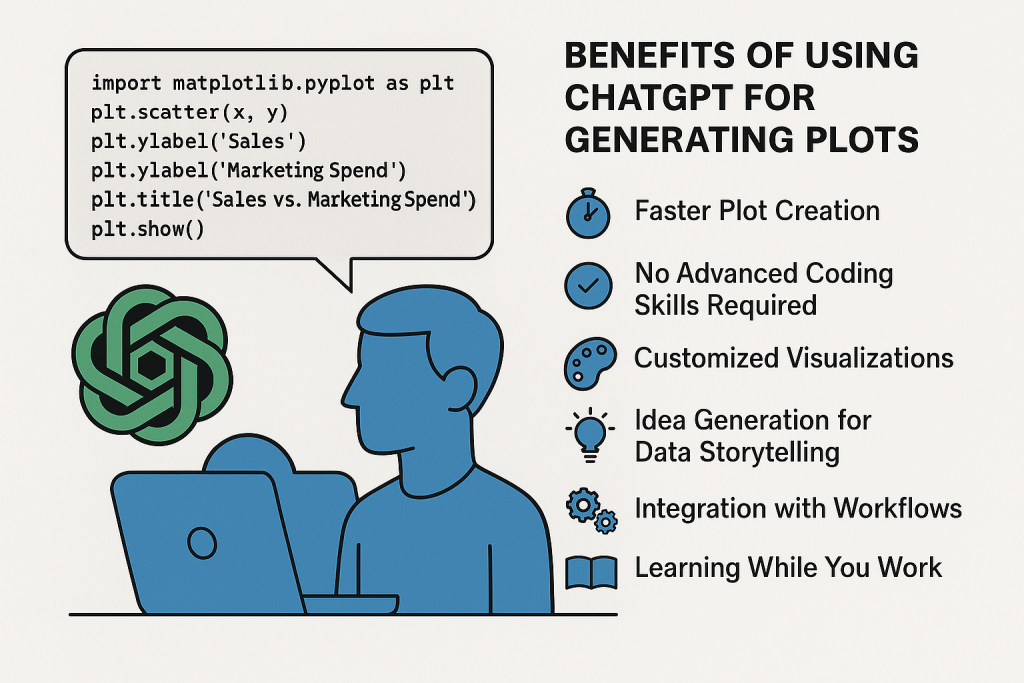
In the world of data visualization, creating effective plots can sometimes be time-consuming—especially if you’re not sure which chart type to use or how to code it. ChatGPT prompts for generating plots offer a fast, intelligent, and accessible way to produce high-quality visualizations without spending hours on trial and error.
Faster Plot Creation. With the right prompt, ChatGPT can instantly provide you with ready-to-use code for libraries. This means you can skip repetitive setup steps and focus directly on refining your visualization.
No Advanced Coding Skills Required. Even if you’re new to Python or R, you can use simple, natural-language prompts to tell ChatGPT exactly what you need—like “Create a scatter plot showing sales vs. marketing spend.” ChatGPT will generate the correct syntax and plotting functions, making data visualization accessible to everyone.
Customized Visualizations. By adjusting your prompt, you can quickly get plots with custom colors, labels, styles, and annotations. This allows you to align the chart with your project’s design standards or presentation style without manually tweaking every detail.
Idea Generation for Data Storytelling. Sometimes the challenge isn’t creating the plot—it’s deciding which type of plot best communicates your insight. ChatGPT can suggest the most effective visualization method for your data and even explain why it’s the best choice.
Learning While You Work. Each generated plot comes with clear, readable code, so you can learn the logic behind the visualization. Over time, this helps you improve your own coding and plotting skills.
ChatGPT Prompt for Generating Plots
Create a list of the most informative visualizations for [dataset name], including the type of plot, variables to use, and insights we can gain from each.
You can also use the search function to find the best prompts for ChatGPT.